Texas Instrument TI‑84 Plus CE-T Graphing Calculator
Price Includes VAT
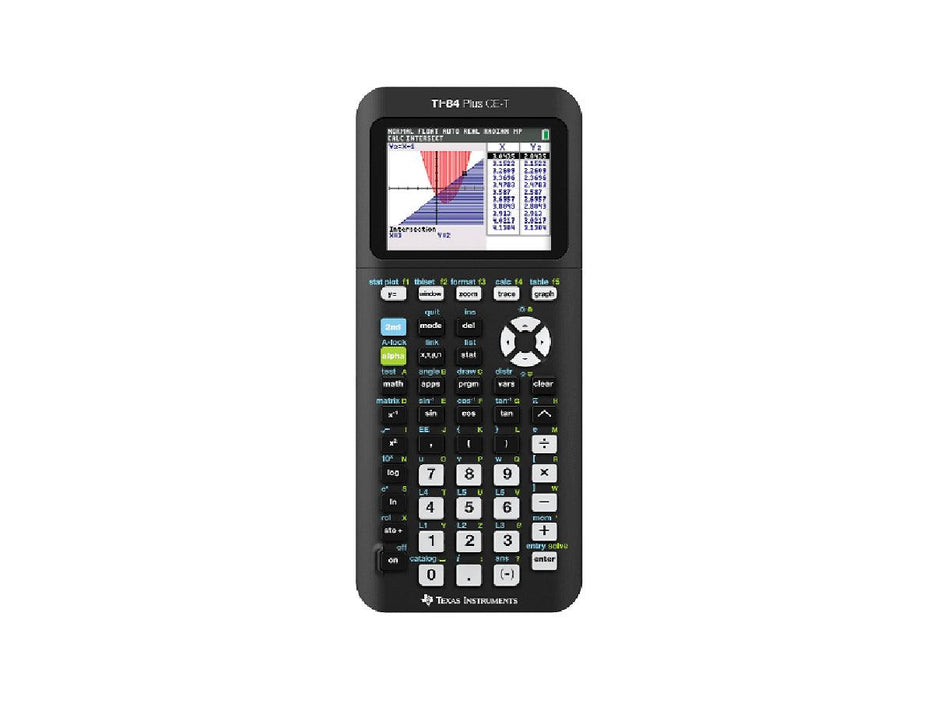
The TI-84 Plus CE-T has advanced graphing capabilities and improved interface features, with a high-resolution colour display and the ability to use images, making mathematical visualization more interesting and encouraging a better understanding of difficult concepts. In addition, it can be used to program the TI-Innovator™ System.
Benefits
● Mathematics and robotics - an ideal combination, perfect for STEM education
● Coding with handheld calculators which can also be used for maths
● Coding with the programming language Basic
Equipment and Technical Data
Hardware:
● Aluminium vehicle chassis
● Rechargeable battery
● Two drive wheels with independent motors
● High-resolution motor shaft encoder sensors
● Marker holder
● Front-mounted ranger
● Gyroscope
● Bottom-mounted colour sensor
● Red-green-blue (RGB) LED
● Slot for the TI-Innovator™ Hub, which serves as the Rover's controller
● Dimensions: 19 x 8.5 x 1.5 cm
● Weight: 254 g
Built-in Functionality:
● Add images to graph background
● 15 colours for function graphing
● Change style and colour of axes and grids on graphs
● Catalogue Syntax Help
● Alphabetical CATALOG of all TI calculator operations in one menu
● Advanced functions accessed through pull-down display menus
● Real and complex numbers calculated to 14-digit accuracy and displayed with 10 digits plus a 2-digit exponent
● Graphs 10 rectangular functions, 6 parametric expressions, 6 polar expressions, and 3 recursively-defined sequences
● Up to 10 graphing functions defined, saved, graphed and analyzed at one time
● Sequence graphing mode shows time series plot, cobweb/stair-step plot and phase plots
● User-defined list names. Lists store up to 999 elements
● 17 interactive zoom features
● Numeric evaluations are given in table format for all graphing modes
● Interactive analysis of function values, roots, maximums, minimums, integrals and derivatives
●8 different graph styles for differentiating the look of each graph drawn
● Horizontal and vertical split- screen options
● Viewgraph and table side-by-side
● Stores up to 10 matrices
● Matrix operations including inverse, determinant, transpose, augment, reduced row echelon form and elementary row operations. Convert matrices to lists and vice-versa
● List-based one- and two-variable statistical analysis, including logistic, sinusoidal, median-median, linear, logarithmic, exponential, power, quadratic polynomial, cubic polynomial, and quartic polynomial regression models
● 3 statistical plot definitions for scatter plots, xy-line plots, histograms, regular and modified box-and-whisker plots, and normal probability plots
● Advanced statistics features including 10 hypothesis testing functions, 7 confidence interval functions and one-way analysis of variance
● 15 probability distribution functions including Normal, Student-t, Chi-square, Binomial, and Poisson
● Business functions including Time-Value-of-Money (TVM), cash flows, and amortization. Full-screen interactive editor for solving TVM problems
● Interactive equation solver editor allows solving numerically for different variables in an equation
● 11 Regression calculations